(*) RESEARCH: Collecting plate appearances: Who is on the rise?
One of the key components in compiling a winning fantasy baseball roster is simply maximizing plate appearances (PA) and accruing the accompanying counting stats. It follows that one of the biggest sources of profit comes from identifying and rostering players who earn more PA than the marketplace expects at the draft.
The purpose of this article is to identify potential new sources of profit in 2013 by looking for common characteristics of players that have earned 650 or more PA in the past. We selected the threshold of 650 PA for two reasons: First, it’s a good proxy for a full-time player because it works out to just about four PA per game over the 162 game season. Second, it’s a round number that makes the math easier!
For the purpose of the analysis, we only consider major-league PA. Minor league stats don't count in your fantasy baseball league so we don't count them here, either.
Analysis 1: Baseline
Since 1996—the first full season after the 1994 labor stoppage—309 different players have amassed 650 PA or more in a season, for a total of 886 such player-seasons, or about 52 individual 650-PA seasons per year. And since 2003, there have been 500 such seasons earned by 205 unique players. These data show that once a player reaches this threshold, he frequently repeats.
In the last few years, though, the number of batters reaching 650 PA has dropped. The last three seasons have averaged just 41 such seasons per year. One possible explanation is that trips to the DL are up (DL days reached an all-time high in 2012). An alternate, but not mutually exclusive, explanation is that managers are employing platoons more often than before.
Whatever the reasons, 650-PA seasons are becoming more rare – and therefore more valuable.
Analysis 2: Age
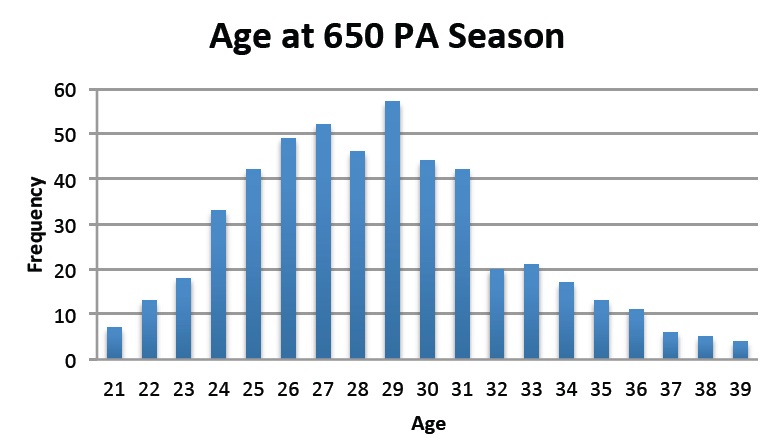
The median age of a batter reaching 650 PA is 28, with 80% of the seasons accounted for by players aged 31 or younger.

Baseball is a physically demanding game, and staying healthy throughout the long season is no easy feat. So it's not unreasonable to think that younger players are more able to play day after day. Similarly, the chart above is also consistent with typical career aging patters, where player performance peaks during the late twenties.
As players begin the decline phase of their career, they will find themselves more often benched for a platoon split or against a tough matchup, or they just might more often get a day off to stay fresh.
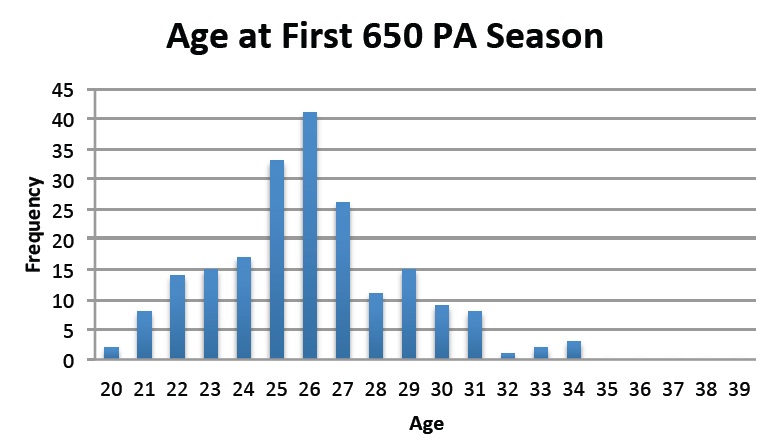
The results above represent the entire sample of players reaching 650 PA and thus include players who have reached this level of PA previously. So, as you might expect, the median age at which players record their first 650 PA season is even younger; that sub-sample has a median age of 26 and 76% of such seasons are posted by players 27 or younger.

Analysis 3: Consistency
Typically, these high-PA seasons do not come completely out of the blue. It’s quite rare for a player to jump from a low PA to everyday levels. Our analysis found that batters averaged 591 PA in the season before the one in which they earned 650 or more PA. And as expected, these players continued to get regular playing time, earning on average 597 PA in the season after their 650-PA season.
These prior-year averages were lower for players reaching the 650 PA threshold for the first time, who averaged just 460 PA in their prior season. However, once they reached the 650-PA threshold, they also continued to see regular playing time, averaging 585 PA in the subsequent season.
However, while the average isn't much different for first-timers than that of the larger population, the distribution was wider. About 51% of batters who reached 650 PA at least twice repeated in the next year. By contrast, first timers repeated in just 39% of the following seasons. The more often players reached the threshold, the more likely they were to reach it again.
Analysis 4: Reliability
We also examined the reliability grades for all of the players reaching 650 PA since 2009 (the first season for which REL grades were available), looking at pre-season REL grades for:
- All players who earned 650 PA
- Players who reached 650 PA for the first time
- All MLB batters
The results:
          650     1st     All
Health    PA+    Time     MLB
======   ====    ====    ====
     A    67%     60%     67%
     B    15%     16%     14%
     C     9%     10%      9%
     D     4%      8%      4%
     F     5%      6%      6%

Playing Time and Experience
===========================
     A    57%     10%     14%
     B    21%     26%     13%
     C    13%     32%     14%
     D     6%     20%     19%
     F     3%     12%     39%

Consistency
===========
     A    20%     24%     16%
     B    40%     32%     24%
     C    26%     28%     18%
     D     9%      6%     10%
     F     5%     10%     33%
What is notable is that 650-PA players are more consistent than the general population. Intuitively, this makes sense—inconsistent performance is likely to frustrate MLB managers just as it does fantasy owners.
Certainly a player more prone to cold streaks is at risk of finding himself on the bench - or the minors - as he tries to get past his slump.
Implications
We can use the findings above to identify the batters most likely to post their first 650 PA season in 2013. We filtered for players who:
- Earned more than 400 PA in 2012
- Enter 2013 age 27 or younger
- And enter 2013 with a REL grade of BBB or higher
We found 15 players who met all these criteria:
Name                REL
===============     ===
Alonso,Yonder       ABA
Barney,Darwin       ABB
Beckham,Gordon      ABB
Brantley,Michael    ABB
Cozart,Zack         BBA
Escobar,Alcides     AAB
Freeman,Freddie     ABA
Gonzalez,Carlos     AAB
Jennings,Desmond    ABB
Maybin,Cameron      ABB
Montero,Jesus       ABB
Smoak,Justin        ABB
Stanton,Giancarlo   BBB
Trumbo,Mark         ABB
Wieters,Matt        ABB
Many of these players could be worth going an extra buck in pursuit of playing time upside and the added runs, RBI and HR that come with extra times at the plate.
One caveat, though: Don’t expect it from the two catchers on the list. In all of MLB history, only eight fulltime catchers (caught 90%+ of games) have ever had 650 PA in a season, the last being Russell Martin in 2008.
For definitions and benchmarks of BaseballHQ.com's most-used terms, see our Glossary Primer.


